DCA blog by PUMA Research Group, University of Amsterdam
What comes to mind when you think about traffic? Pollution? Congestion? The unmistakable noise of an old motor scooter? For many of us, the idea of traffic, especially urban traffic, brings with it many negative associations.
But what is traffic, exactly? If you ask traffic engineers, the conventional experts in this area, they would likely tell you about the volume of motor vehicles on a highway, the number of turning movements at an intersection, or the seconds of delay that a stopped tram is causing. These indicators are important if your goal is to maximise movement on a street, but can we view traffic as more than just volumes? As social scientists studying mobility and accessibility in the context of our cities, we can choose to see traffic through an entirely different lens. Traffic is more than just a dry and technical study. Traffic represents the life of a city.
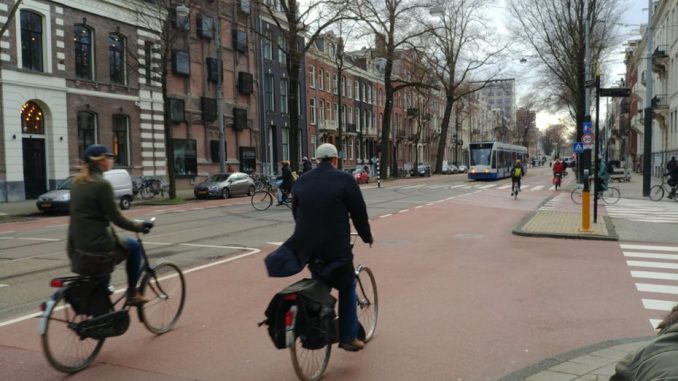
We stood on the northern sidewalk of Sarphatistraat by the University of Amsterdam, eagerly observing traffic going east to west. Here is how a traditional traffic count would measure the street in the span of ten minutes:
- 101 pedestrians
- 89 bicycles
- 39 cars
- 3 trams
- 0 trucks
What is missing here? Lost among the quantitative data are the details about the interactions between everyone moving about. “… when the individual is in a public place, he is not moving merely moving from point to point silently and mechanically managing traffic problems,” states the Canadian-American sociologist Erving Goffman: “… getting from one point to another is not the only purpose and often not the main one; individuals who are vehicular units will often be functioning in other ways, too, for example, as shoppers, conversationalists, diners, and so forth…” [note].
How might we, as social science researchers, gain insight into these activities on the street that are concurrent with the activity of transportation? We decided to turn the traffic count on its head. Here are some behaviours that we observed during the same ten minutes:
- 10 drivers that were seen overtaking cyclists on the bicycle priority street.
- 2 pedestrians, 4 scooter drivers, and 26 cyclists were using headphones
- 16 pedestrians and 2 cyclists looking at their phones
- 34 cyclists riding with one hand
- 8 children on parent’s bike
- 2 scooters carrying a passenger
And why only mobile activities? Stationary activities can add just as much value to the street as people moving across an imaginary line. Take, for instance, one of us who observed 19 stationary activities in ten minutes within visual range, including people chatting, texting, waiting, and taking pictures.
What else can you observe in 10 minutes? Take a look at this 360 degree video and see for yourself.
According to the traffic engineering paradigm, maximizing flows is the primary purpose of the street, yet infrastructure that moves people is different from infrastructure that moves electricity, water, gas, or sewage. Unlike utilities, every person engaged in the act of movement is at the same time experiencing that movement, and our metrics for evaluating the quality of the street should also measure the quality of these experiences, not just the quantity of movement. When evaluating the success of transportation in the city, not everyone is concerned with getting from A to B. The cry of a child. A wave from a friend. A smile from a stranger. As city builders, we should be aware that being on the move is a meaningful experience in itself.
Picture by authors
[note] Goffman 1972, quoted in Ole B. Jensen (2006) ‘Facework’, Flow and the City: Simmel, Goffman, and Mobility in the Contemporary City, Mobilities, 1:2, 143-165, DOI: 10.1080/17450100600726506
