DCA blog by Samuel Nello-Deakin
Department of Geography, Planning and International Development, University of Amsterdam
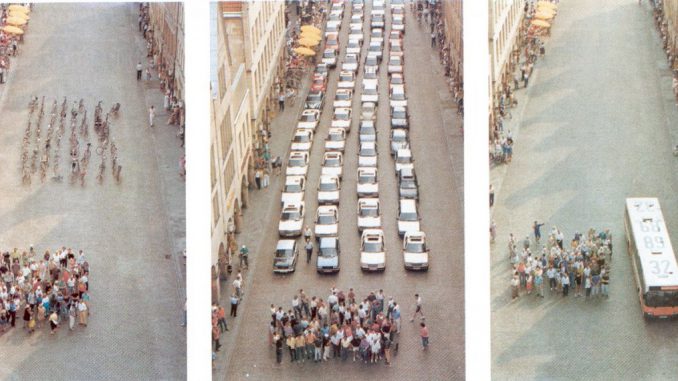
If you consider yourself a cycling or public transport advocate, chances are you will have come across this image – or one depicting a similar situation – before. The image was originally commissioned by the city of Münster’s planning department in 1991, and reflects the amount of road space necessary to move an equivalent number of people using different modes of transport. In doing so, it shows how inefficient cars are in their use of road space compared to pedestrians, cyclists and bus users. Indeed, cars take up a disproportionately large amount of road space in most cities over the world – a situation which can only be described as plainly unfair.
In recent years, a number of studies have actually sought to measure the exact percentage of road space dedicated to cars and comparing it to their local modal share (i.e. the total percentage of trips made by car in a city) in order to point out the unfairness of this situation. In Berlin, for instance, cars take up 58% of all road space, but only constitute 33% of all trips [note].
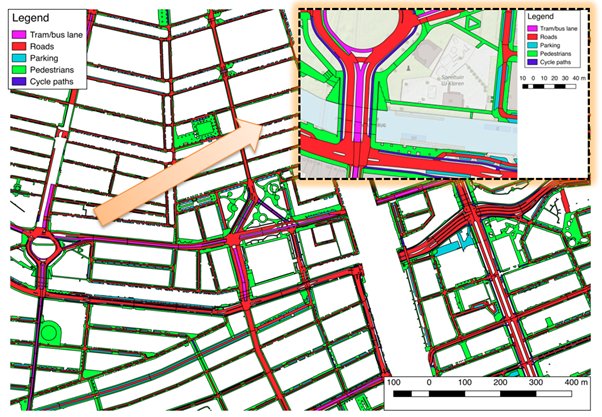
As a regular cyclist and urban mobility researcher living in Amsterdam, I had long wondered about what the distribution of road space between transport modes in Amsterdam might look like. Intrigued by this question, I eventually found out a way of measuring it using highly detailed GIS cartography. My findings showed the following: cars in Amsterdam are given 51% of all road space, while pedestrians and cyclists occupy respectively 40% and 7% of road space. This raised some interesting questions. Given the fact that cyclists constitute 27% of all trips in Amsterdam, why shouldn’t they accordingly deserve 20% more space?

GIS visualization showing the distribution of road space between transport modes in central Amsterdam
Upon closer reflection, however, I came increasingly unsure about this line of reasoning. Pedestrians, for instance, only constitute 18% of all trips within Amsterdam, but my measurements showed that they are given 40% of road space. Does this mean they deserve less space? This didn’t feel right.
I eventually came to the conclusion that although the idea that we can define a “fair” distribution of road space (based on modal split or any other indicator) is an appealing one, it is ultimately a flawed one. Using my findings on the distribution of road space in Amsterdam as illustration, I have attempted to explain why in a recent article published in the Journal of Urban Design. Firstly, and as the example of pedestrians in Amsterdam shows, arguments in favour of the redistribution of road space based on mode split do not necessarily favour a progressive transport agenda. Secondly, different transport modes have profoundly different characteristics, sizes and speeds. This means that the space requirements of different transport modes simply cannot be judged using an identical measure. We expect cars to pile up at junctions, for instance, but not pedestrians to pile up on sidewalks in a similar way. Finally, thinking about road space as something to be divided between different transport modes ignores the existence of shared spaces where different modes coexist with each other. Even more fundamentally, it ignores the fact that streets are not only spaces for movement, but valuable public places in themselves. In Amsterdam, for example, many secondary streets are used mainly by cyclists rather than cars, and may even be used by children playing on the street.
The full academic (open-access) article this blogpost is based upon can be found at: https://doi.org/10.1080/13574809.2019.1592664

You must be logged in to post a comment.